
There is massive amounts of telemetry in the data center. All sorts of information buzzing around! Interesting events happen all the time. Unfortunately, being able to collect all the telemetry is a challenge, and these telemetry collecting solutions are still being slowly deployed in many data center networks. I think we are starting to see a bit of a quickening happen in this space. Lately, TELEMETRY has been the battle cry of the day. Yet again, this is another episode in the inability to quench the thirst for data. Everybody wants more and more data. There is value in the data. It’s like oil. Cool, I am glad to see the uptick in organizations wanting network telemetry. The only problem is, how do you collect enough to see the whole picture, and how do you get it to feed back into your infrastructure.

So we have good news on all fronts! With the HPE Aruba CX10K switch, you can push local switch traffic into a pair of DPU chips, bolted directly to the Trident 3 chipset. With this technology, you can send IPFIX flow information where ever you want, including an Apache Kakfa server :-). Now that we have a target IPFIX collector, we can deploy sensors to watch the IPFIX collector and report back on any desired search data. Like TCP/UDP port numbers. So, the missing link is a sensor, then perhaps another function to process the information and apply some sort of logic. Based on that logic, forward out some API call to change whatever you want? Sounds far fetched? Nah, its just the next generation of a project I started called the Data Services Engine. Read more about that, here

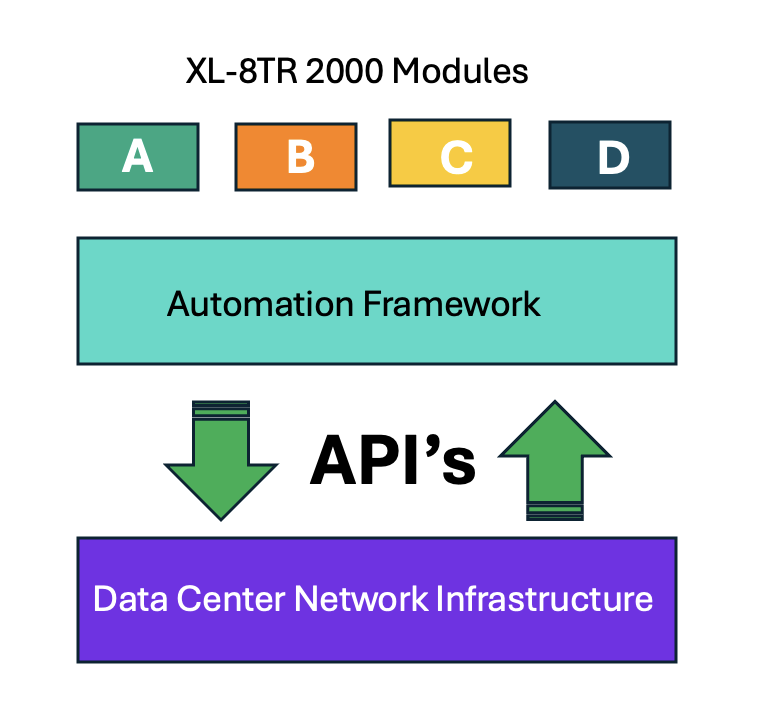
You can see in the diagram above, sensors listen for events, load triggers, triggers wake up rules and run actions that can call automation scripts from a host of integration modules. Those actions change the infrastructure below. Does this look familiar, it should. The underlying framework for the XL-8TR 2000 is StackStorm
The real magic of XL-8TR 2000 is a set of modules specifically developed to monitor IPFIX flow records in an Elastic Search server. Another integration will push firewall policy to the AMD Pensando Policy Services Manager (PSM). The workflow can call actions for any integration module. They can be strung together like this:

With this technology, anything you can document, you can automate. No, not can….should automate. Below is another diagram of actions….errr, in action :-)”

When deployed with the correct integration modules, a “closed loop” or feedback loop is created. A communication pathway from the infrastructure, to the infrastructure. With enough effort, you could have you whole data center talking to itself. I would only assume that would be a good thing!
In the final image below, you can see a solution for completing the feedback loop for IPFIX driven, 4th generation, closed loop architecture for enterprise data center networks.

As always, thank you for being the seeker of knowledge you are. If you wound up on this blog, you must have been digging deep. Glad you stopped by.